
Where is your lead-generation funnel going wrong? The Behavior Flow report knows! Google’s Behavior Flow report is an excellent tool to help you optimize your site for lead generation.
The Behavior Flow Report is a Google analytics tool that can show you what parts of your site are getting the hits and what parts are being left out in the cold. It tracks the pathways your visitors use as they navigate your site, allowing you to identify potential trouble spots in your lead-generation funnel.
To use the Behavior Flow report, you’ll need to have Events and Content Groupings set up. Once you do, sign onto Google Analytics, go to your view, open Reports, and select Behavior > Behavior Flow.

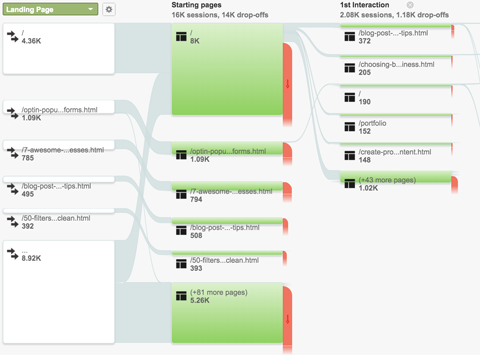
Example Behavior Flow Report. Source: socialmediaexaminer.com
As the title implies, the Behavior Flow report tracks the flow of your visitor traffic, using what are called Nodes. Nodes are either a localization, a page or group of pages, or an event such as a video play. These are color-coded on the report itself: green for page nodes, blue for event nodes, and white for dimension nodes.
Connections go between nodes, and you can click on these to see the flow of traffic from one node to another. Exits show where users left the flow—i.e. didn’t trigger a subsequent node. With a page node, this means they leave the page, but with an event node it merely means that a subsequent event was not engaged. For example, they played a video that did not immediately start another video.
With this data you can determine if segments of your site are over- or underperforming. Is there a specific place on the funnel that’s losing traffic? Is there a path more popular than others? Figure out which parts are working and which aren’t, and make the second parts more like the first. All of this can be incredibly useful in optimizing your site.


